


18 December 2020 Anomaly detection with HTM: an interesting case studyADTS AD |
5.1 An example of market driven anomaly
As a conclusion of this blog post series, we would like to present an interesting case study emerged during the analysis on the MTA market data series, described in the previous blog post.
On the 9th November 2020, at 12:46 the network detected an anomaly caused by a sudden change in the CNT value. The number of executed contracts increased from an average value of 500 to an average of around 3500 in less than two minutes. The following image shows the aforementioned anomaly.
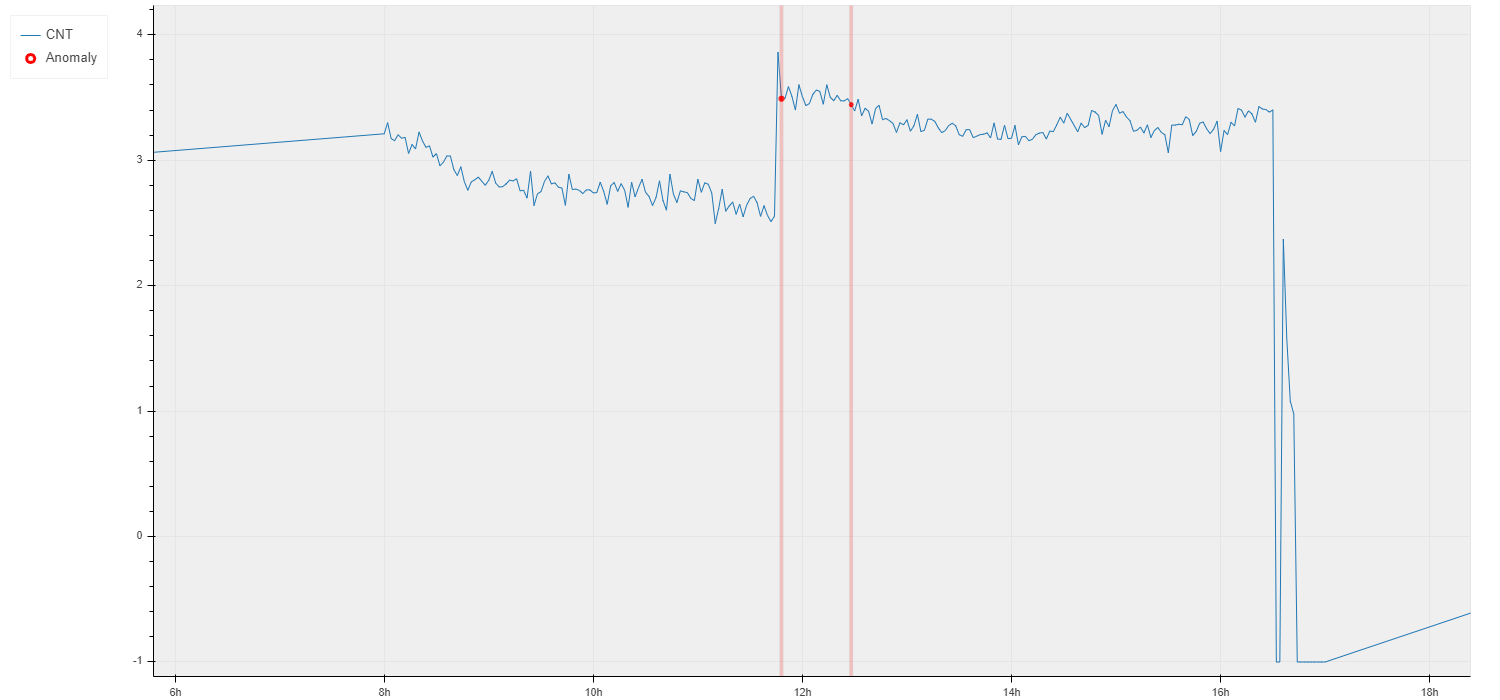 |
This anomaly is interesting because it is caused by a change in market activity. In fact if we check, for example, the FTSEMIB index in the same hour we note a sudden increase in the value of the index. The next image shows the trend of the FTSEMIB index on the 9th November 2020 (source yahoo.finance), with the great increase starting at 12:42.
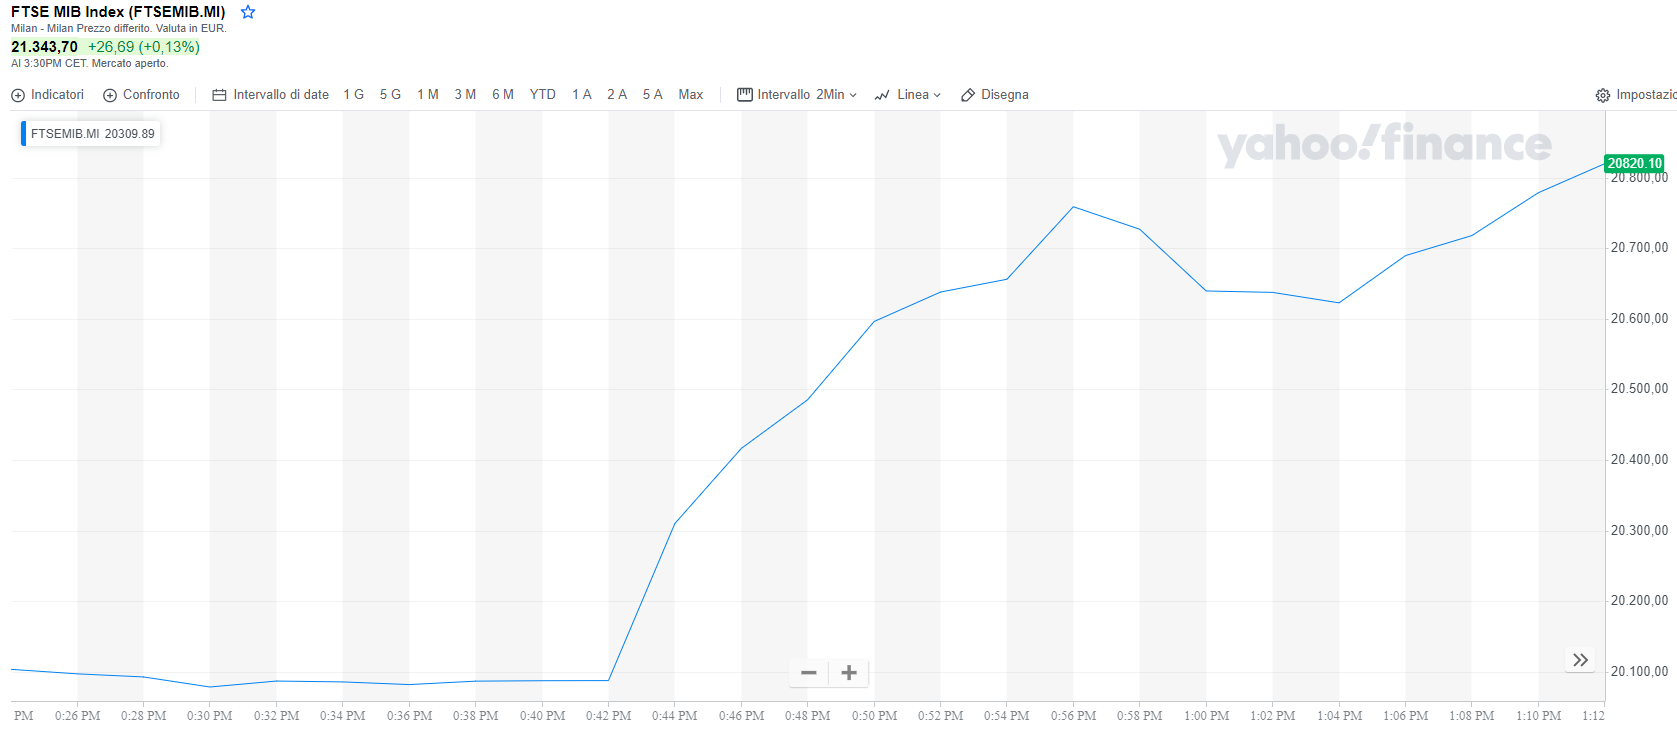 |
5.2 The cause of the anomaly
Unfortunately the HTM network can’t tell us the reason why an anomaly occurred, so to figure it out we need to do some further investigations.
There are many indications that make us think that the sudden growth of the FTSEMIB index (and also of other indexes worldwide) is probably due to the Pfizer’s COVID-19 vaccine announcement, that was released on the 9th November 2020 at 12:45 as we can see in the next image.
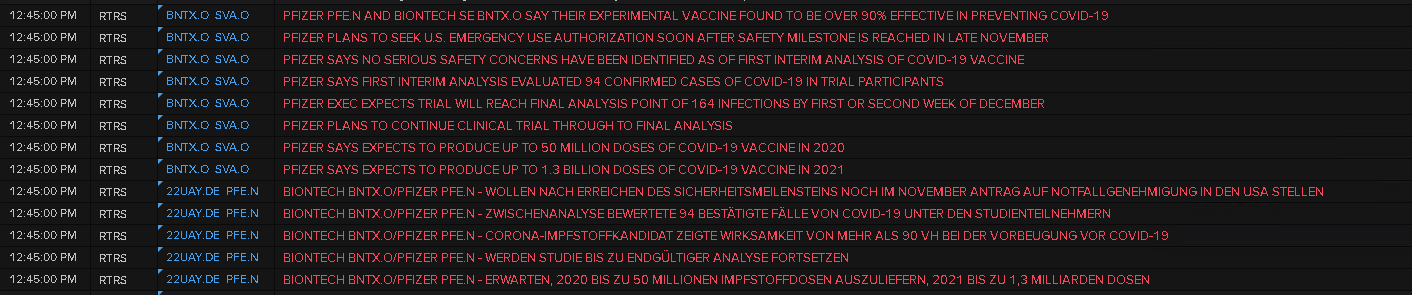 |
The delay between the vaccine announcement and the anomaly may be due to the frequency of the input data stream. In fact, as we have said in the previous post, new input data are collected every 30 seconds, and they are also aggregated in time windows of 2 minutes. Therefore we can expect to detect an anomaly more quickly by using data with a higher frequency.
A similar behaviour as the one above can be seen on the 16th November 2020, when the network detected an anomaly at 12:52 (see the figure below).
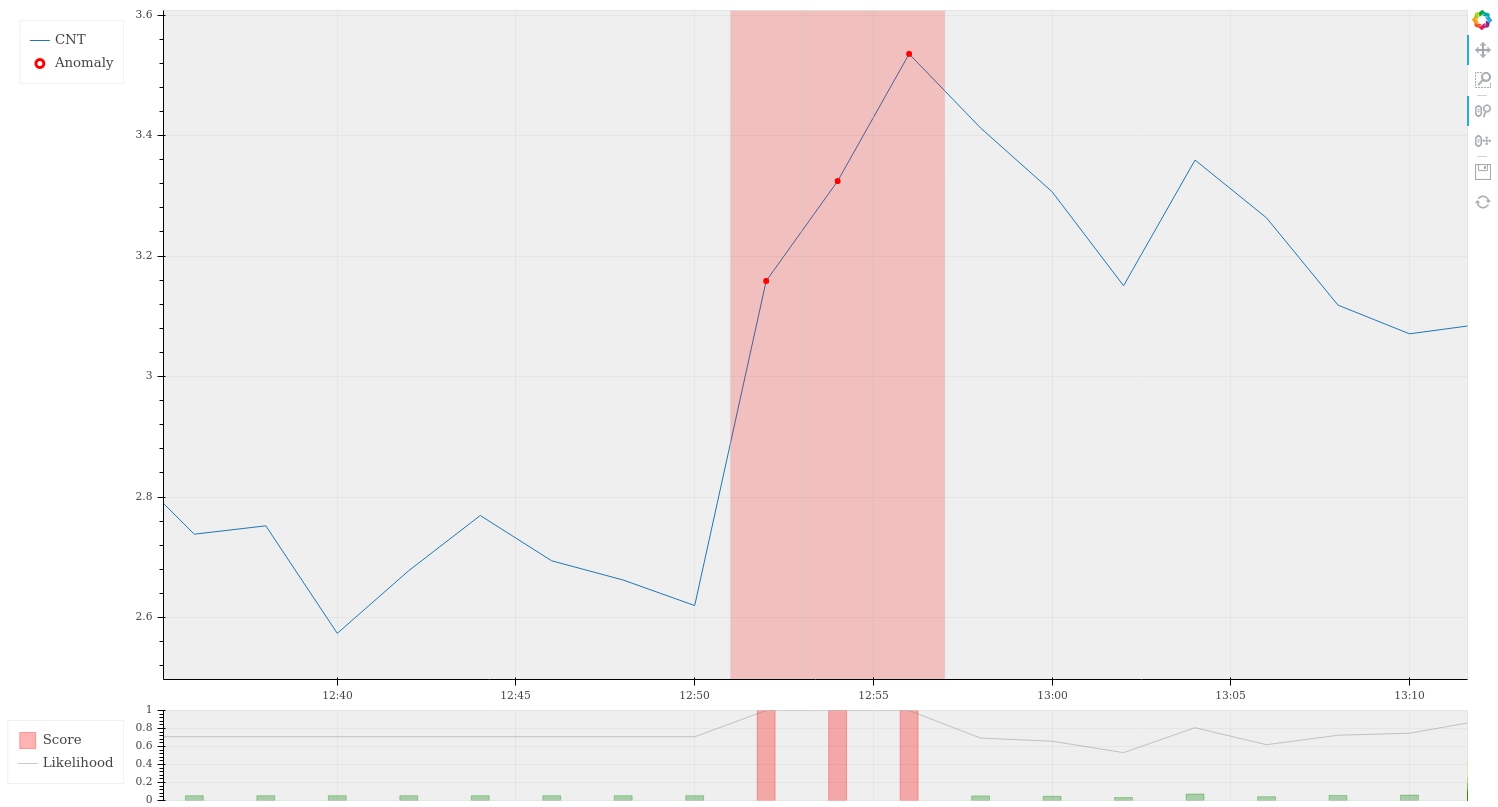 |
This anomaly was due to the announcement of the Moderna’s COVID-19 vaccine.
In conclusion these anomalies, together with other examples we have collected, show that the Anomaly Detection Tool on the MTA market works pretty well both with market linked anomalies and with data collection system anomalies. After the MTA market, the tool has been applied also to EuroTLX and HiMTF markets, with similar results.
Future applications of the tool could be the monitoring on other kinds of real time streaming data. Since it works regardless of the meaning of the underlying data it could be applied to very different contexts, such as monitoring the number of VPN accesses to a network or the market prices of a stock.