


16 December 2020 Anomaly detection with HTM: a real world exampleADTS AD |
4.1 The dataset
In this blog post we would like to show an application of the HTM network on a real world time-series.
The dataset used consists of a real-time stream of the number of executed trades on the MTA market, every 30 seconds, starting from 15-Nov-2019. Below is an extraction of a few records from such dataset just to give the idea. Note that, since we are using a real time data series, this dataset is continuously updating with a new entry every 30 seconds.
| TIME | CNT |
|---|---|
| 2019-11-15 09:56:00 | 475 |
| 2019-11-15 09:56:30 | 602 |
| 2019-11-15 09:57:00 | 596 |
| 2019-11-15 09:57:30 | 298 |
| 2019-11-15 09:58:00 | 460 |
Our objective is to detect possible anomalies from this dataset. We want to point out that we cannot say anything about anomalies detected, so we don’t know if an anomaly comes from market operations or from some problem in the data collection system.
4.2 The dataset preprocessing
Before passing the dataset to the HTM network, a little of preprocessing is needed.
Firstly, in this specific case we don’t want to pass a new data entry to the network every 30 seconds, but we aggregate the input CNT data in time windows greater than 30 seconds (e.g. 2 minutes time window in our example) and we take the mean over this time window as the new input CNT value. In this way we deal with the noisy data.
Secondly, instead of the raw CNT we use a base 10 log transformation, in order to have a logarithmic scale in the graphic visualization and also a normal distribution of the input dataset.
The last thing that we need to do is to handle the holes in the dataset. The data entry stream occurs when the market is open, between 9:00 and 18:00. It is possible to have holes in the data stream during this time period. In this case CNT is set to zero before the aggregation and the logarithmic transformation. If the mean value of CNT is zero also after the aggregation, then it is set to 0.1 in order to make the logarithmic transformation possible. So in the logarithmic scale zero is replaced by -1.
4.3 The output
The preprocessed data are passed through the HTM network. The encoders used for the input data are a TimeOfDay Date Encoder for the TIME and a Random Distributed Scalar Encoder for the CNT (see Biological and Machine Intelligence (BAMI)).
The table below shows an example of the output of the network:
| TIME | log CNT | anomalyScore | anomalyLikelihood | logLikelihood |
|---|---|---|---|---|
| 2019-11-20 16:10:00 | 2.984865 | 0.025 | 0.718284 | 0.055019 |
| 2019-11-20 16:12:00 | 2.930822 | 0.025 | 0.693408 | 0.051344 |
| 2019-11-20 16:14:00 | 2.882951 | 0.000 | 0.693408 | 0.051344 |
| 2019-11-20 16:16:00 | 2.970114 | 0.025 | 0.667607 | 0.047835 |
| 2019-11-20 16:18:00 | 2.973012 | 0.000 | 0.667607 | 0.047835 |
where the anomalyScore and logLikelihood are defined in the previous blog post. With an output table like the one above, we can plot the pattern of the data and highlight the potential anomalies when they are detected.
The typical daily pattern of the CNT quantity (in logarithmic scale) is shown in the following image from the day 3 November 2020.
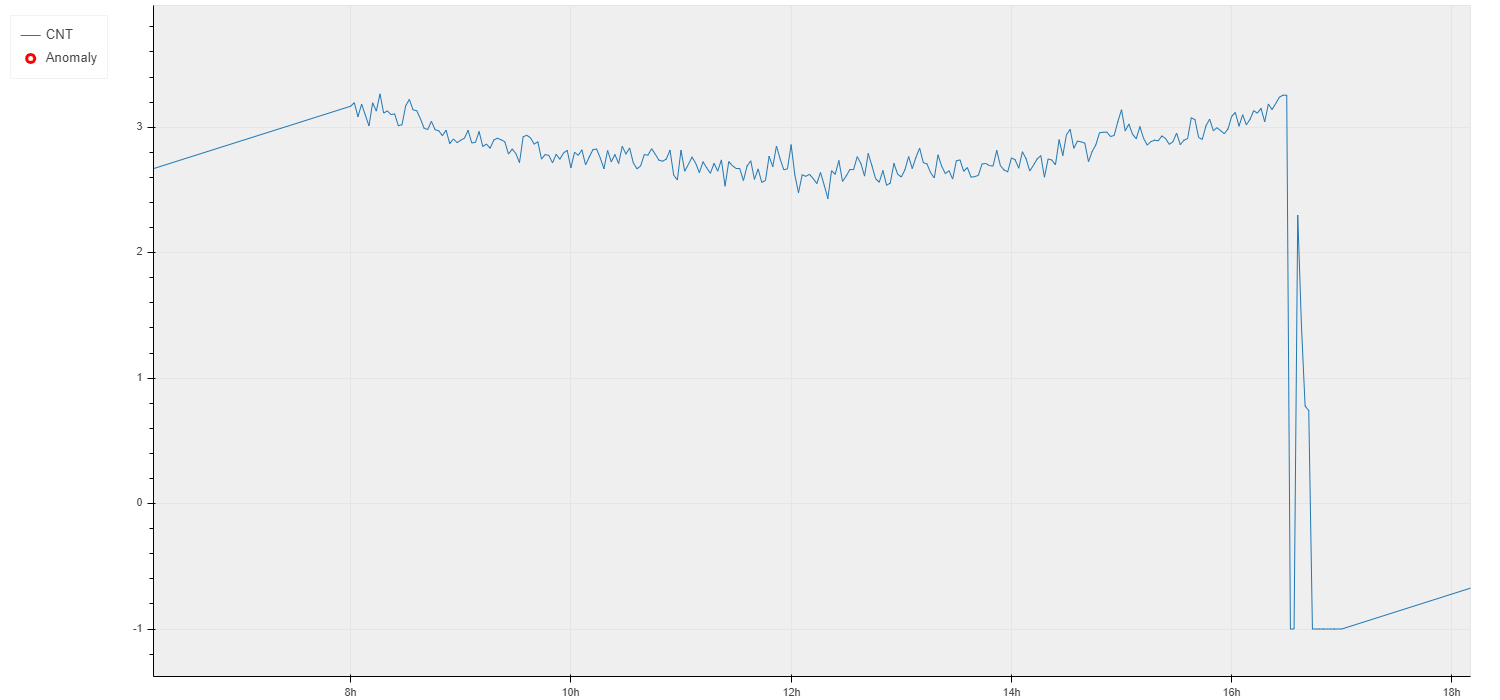 |
In the next image we show an example of an anomaly detected on the 10th November 2020 at 12:46. In the image the Likelihood and the LogLikelihood (simply called Score) are also shown. An anomaly occurs when the Score is higher than 0.5 (red bar in the chart below), if it’s between 0.3 and 0.5 then a warning is raised (yellow bar in the chart below).
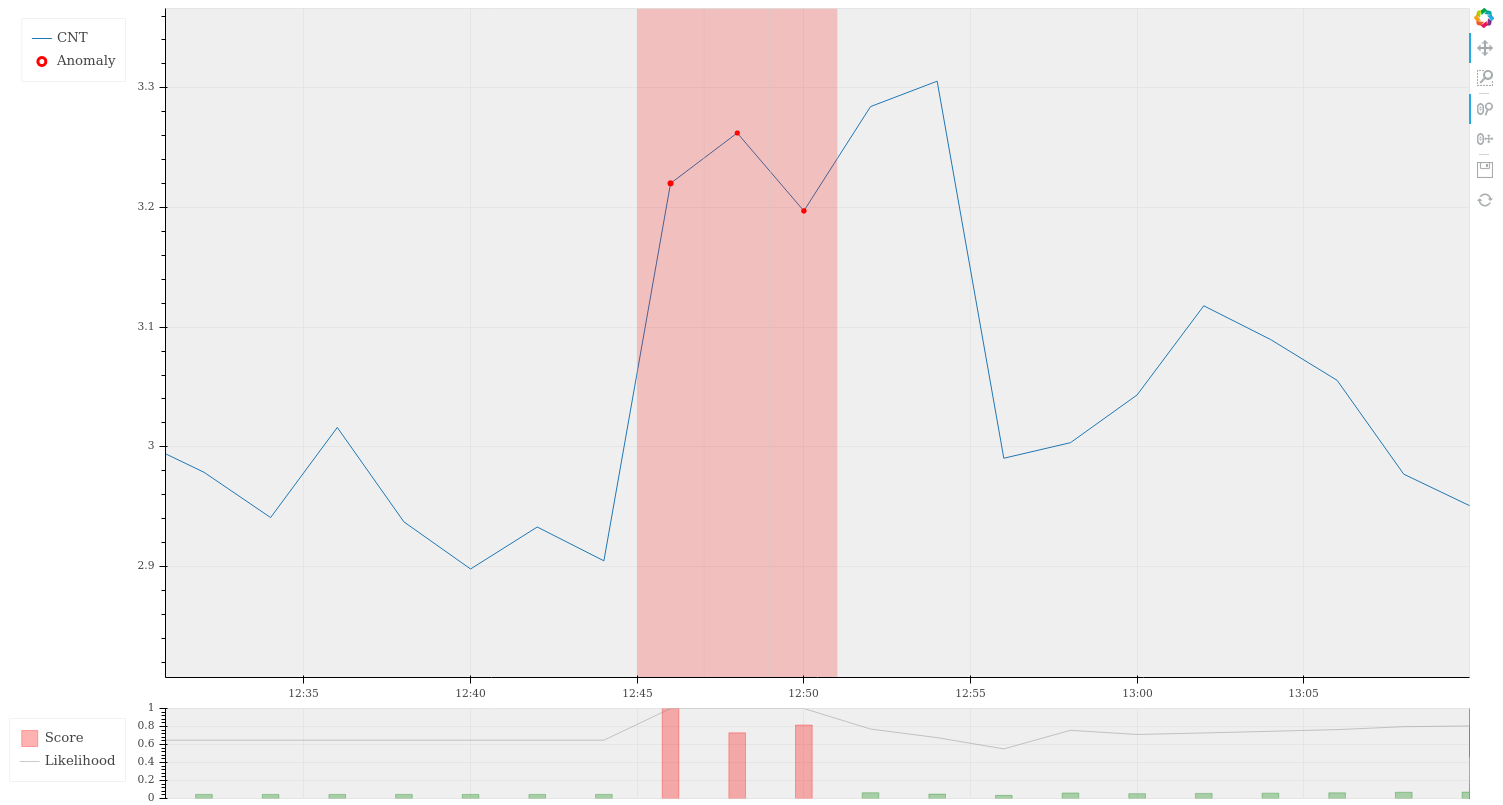 |
Investigating further, we have discovered that this anomaly is related to a particular downward trend of the FTSEMIB index, as we can see in the next image (source yahoo.finance).
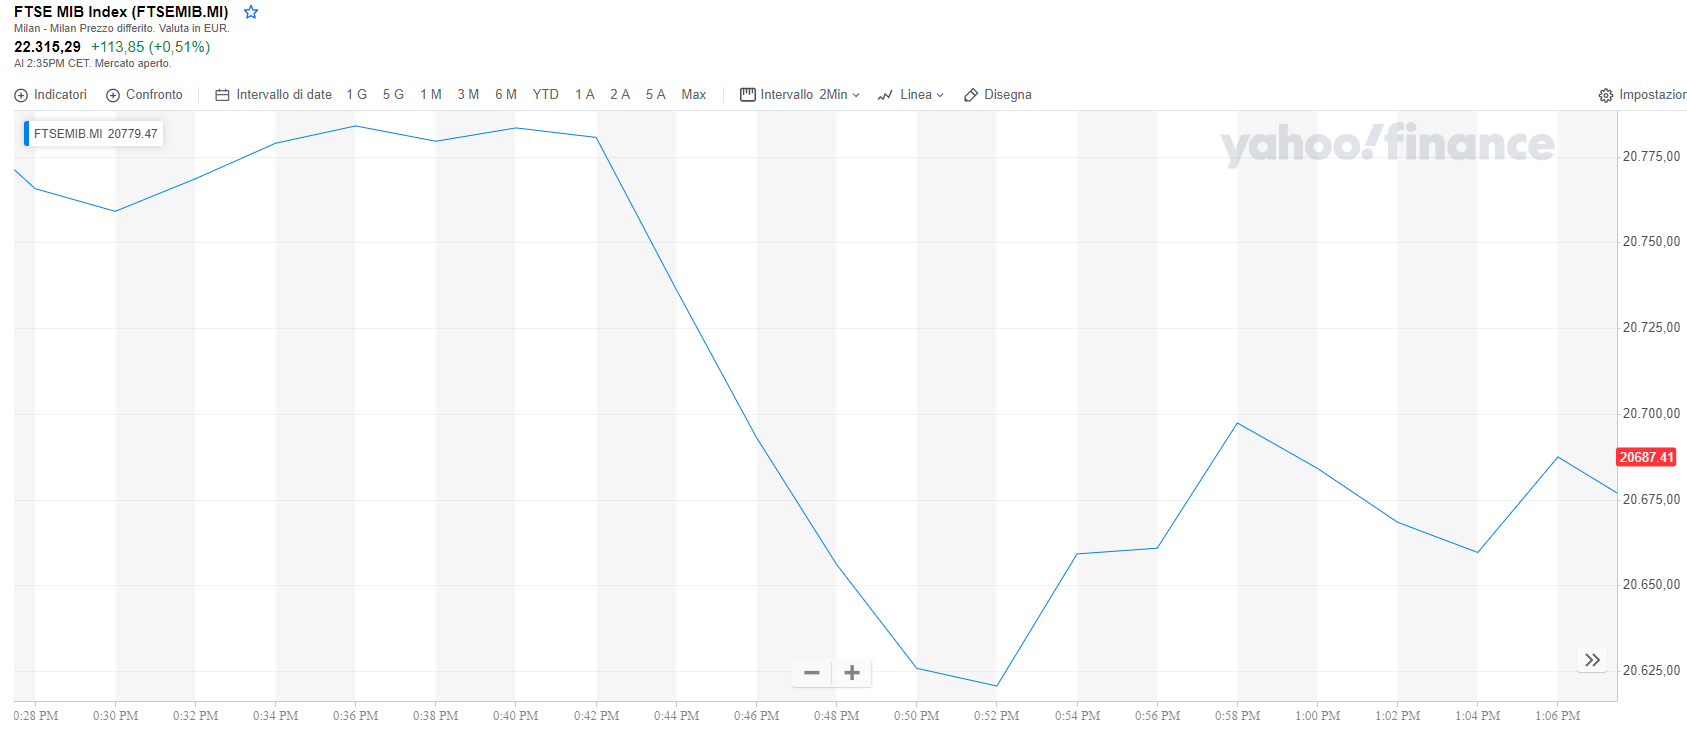 |
The next image shows the trend of the anomaly detection tool during the days from the 21st October to the 20th November 2020.
 |
In the next and last blog post we will deal with the interesting anomaly detected on the 9th November 2020, that you can also see in the plot above.