

14 February 2022 Market Abuse. Results for the reduction of false positives alarmsRF MA imbalance FP |
Results description
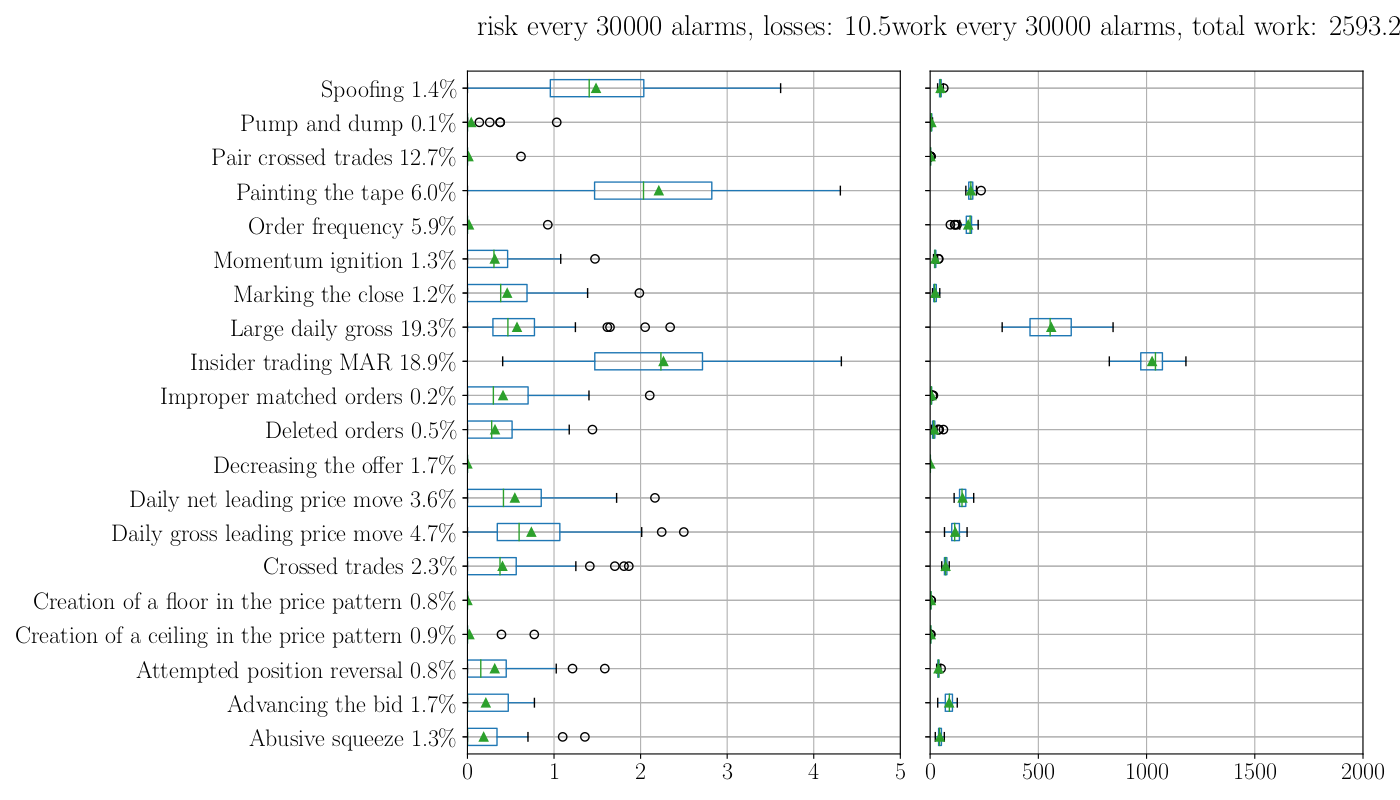 In the above picture we can see the results in terms of RISK, the chart on the left, and WORK, the chart on the right.
For each pattern, represented in the rows, we performed a total of 100 experiments, each returning a RISK, and a WORK value. The 100 results are then summarized as a box plot, so eventually for each pattern in the rows we got a box plot for the RISK (left) and a box plot for the WORK (right).
Each experiment consist of:
- random splitting the dataset of the pattern into a training and a testing subsets (80% of the alarms for the training and 20% for the testing),
- performing the training of the RFA,
- computing the confusion matrix on the testing set,
- computing the RISK and WORK as described in the previous post.
Since the alarms in the training and testing dataset are randomly chosen, results are different for each experiment. Repetitions were made to test the robustness of the method regarding changes of the inputs and to assess the RFA’s ability to generalize.
In the above charts we have also marked with a green triangle the average of the 100 experiments for each pattern. In what follows we will refer to this value as the average result for each pattern, for example, the LDG has an average RISK about 0.5 and average work about 550.
These results are presented for an overall set of 30’000 alarms. This number is because of the average number of alarms that the MAD System is generating for the primary tier one Italian Bank in one month. It is the work that the compliance officer of this bank is doing in one month without the support of the ML.
If we sum the average results for all the pattern, we obtain that the total residual WORK that the bank will face with the support of the ML will be 2’593 alarms. It worth to be clear here: it means that with the support of ML the number of alarms would be reduced from 30’000 to 2’593! More than 90% of work saved!
What is the RISK instead? Summing the average RISK for all the patterns we obtain 10.5. It means that in one month, allowing the ML to close automatically the alarms the compliance officer risks missing about 10 market abuse to the regulator. This value it may seem high, but if you look carefully the charts you may notice that almost all the risk is due by the “Insider Trading” and the “Painting the Tape” patterns. They bring together five of 10 of the RISK.
We are still investigating why these two patterns perform worse than the others. It may be due to the intrinsic complexity that discovering these kinds of abuse brings. More likely the difficulty lies in the fact that the alarm message, that we used to generate the dataset, is not rich enough to provide all the relevant information needed to take a decision about the alarm. We are looking for other relevant information that would be worth adding to the dataset.
For some of the patterns the ML perform very well. Take for instance the “Pair Crossed Trades”, which is involved in a relevant part of the generated alarms (about 12.7%). The WORK and the RISK are almost zero, meaning that the ML will be able to do all the job by itself. The compliance officer will have nothing to do again on this pattern!
Conclusion
This kind of approach based on ML to close automatically the false positive alarms, generate by a MAD System, seems to be promising, especially for some of the most frequent patterns.
Obviously, since it is a supervised learning approach, it requires that the past work of the compliance officer is present, therefore she has to spend a sufficient time and effort on the alarms classification. We cannot go to a newly opened office and tell: “OK we can solve your problem with ML!”. It requires that the people of the office put their efforts for a time that is sufficient to collect a dataset large enough to train the ML algo. The good news is that the RISK and WORK metrics allow to assess the RFA at any moment, being able to make confident judgments about whether the ML algo is ready for production.
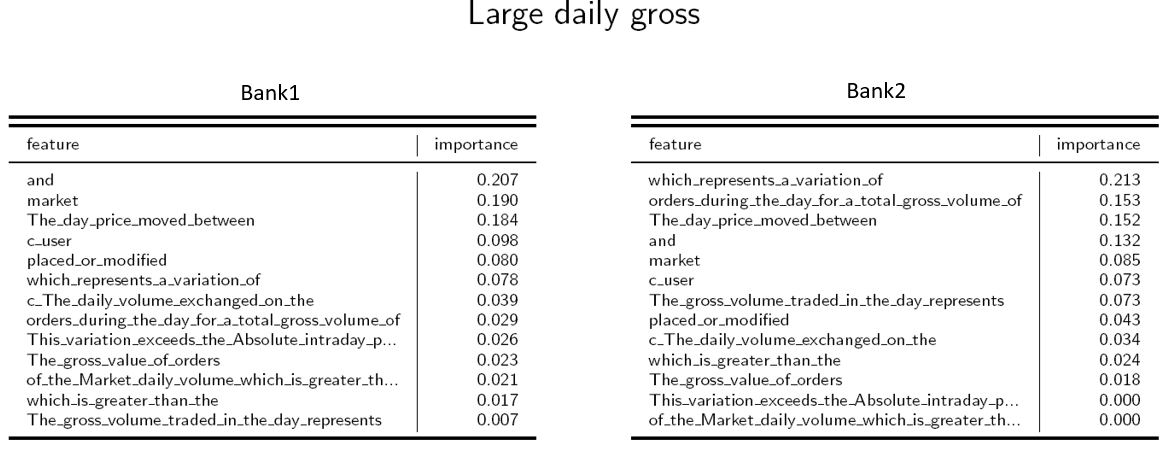
We also evaluated the ‘transfer learning approach’. It consists in training the algo on the dataset of a Bank1 and then supply the Bank2, the one with the newly set up office, with an already-trained-RFA.
In our experiment we tested how the RFAs, for which we presented the results in this post, would behave if called to classify alarms generated by a different bank. To this end, we collected alarms of another tier one European Bank, but we found that the RFAs don’t perform well. The point seems to be that the compliance officers are using different criteria for the classification: the RFA that has learned to classify according to the methods of the first bank is in fact not able to classify the alarms of the second bank. The inspection of a trained RFA allows to see this evidence: the ‘feature importance’ of, for example, the LDG pattern for the two banks shows a different ranking of the features implied in the alarm messages.
We can conclude here this series of post. We have shown how the ML approach can be promising to solve the problem of false positives alarms in market abuse detection for a compliance officer with a past story of activity in this task. We showed how much work could be saved by adopting ML at the expense of a minimum risk for almost all the patterns.