

12 April 2021 NFK model and LIST Smart OrderOptExec RL |
5.1 LIST Smart Order
As said in the previous post, our reinforcement learning approach proved to achieve significantly good results, when compared to a naive strategy like the Surrogate Smart Order. Here, we want to go a step further and check the performance of the NFK model against the actual Smart Order policy.
Let us rememeber that, given the intervals into which an order can be divided following a certain volume curve, the LIST Smart Order pursues a strategy consisting in placing, within each of these intervals, succeeding limit orders at the ongoing best price, wishing that one or more of them will be hit by some market order. Finally, if left with some unexecuted quantity at the end of the interval, it submits a market order with the remaining shares, so as to execute all the quantity $q$ of the child order at hand.
5.2 NFK versus SO
The comparative analysis between the NFK model and the LIST Smart Order has been applied to the dataset described in Sec. 3.1 of the third post, that is, our RL algorithm has been trained on the FTSE MIB limit order book and tested on the orders released by a “List customer specialist in equity markets”, in the period 1/1/2020-30/4/2020. Specifically, as done by the SO, each of the orders at issue has been broken up into child orders according to the green volume profile which, we remind, is a curve identical for all the stocks and all the days in question. The reason for this choice is to make the two models consistent and thus be able to carry out a homogeneous comparison between the two.
Among the nearly 40 stocks of the FTSE MIB index in the period concerned, we decided to restrict our study to the $n$ most capitalized ones, i.e. the $n$s owning the largest overall market values, where $n$ is at choice (to find out more, see the Wikipedia page on capitalization).
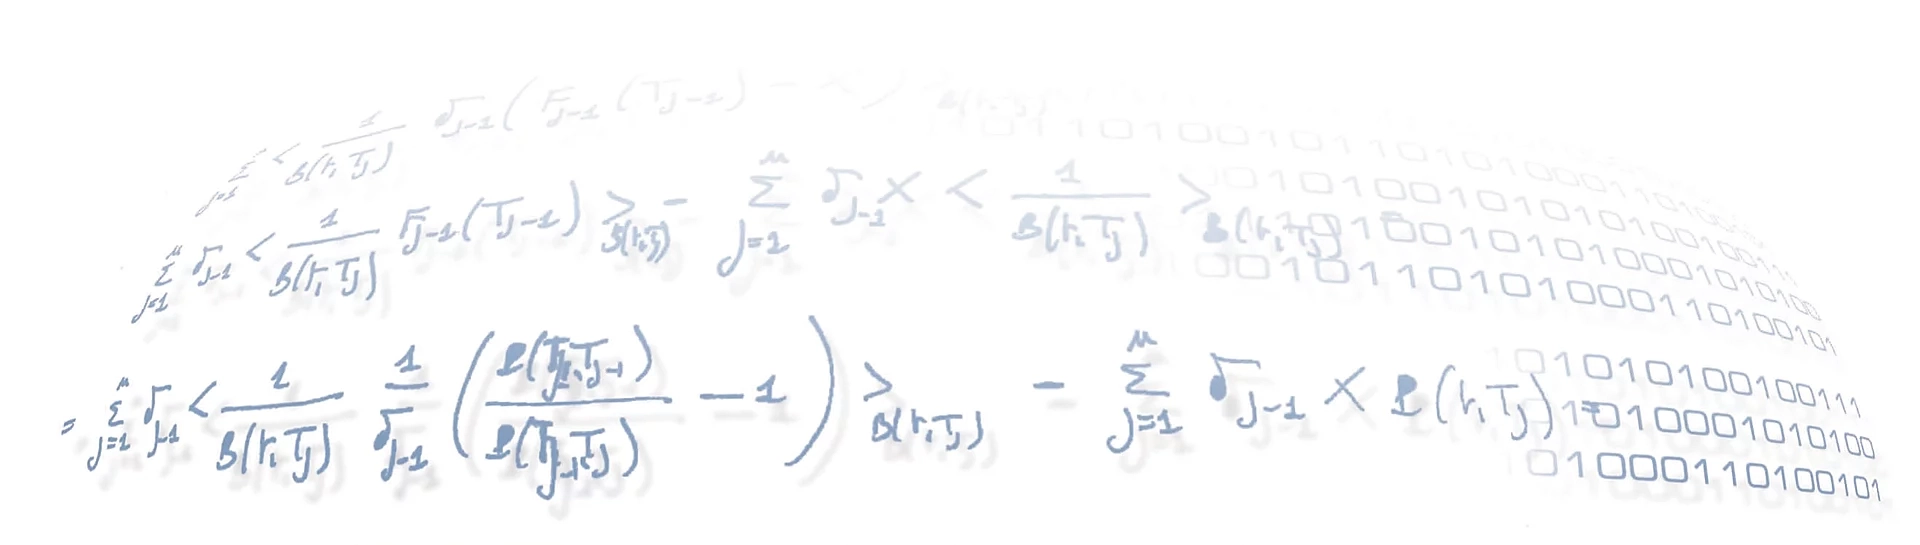
In order to compare the performances of the two strategies, we have adopted specific gain and risk measures. Particularly, as indicator of the overall gain of NFK over the SO we have chosen the total relative Profit and Loss, both in cash (euro) and in basis point units, namely:
and
Here, the sums are all over the totality of the orders involved, $\sigma_i$ is the sign of each order ($-$ for buy, $+$ for sell), $Q_i$ is the global order volume, while and are the volume-weighted average prices obtained for each order by using the NFK and the SO policies, respectively. As criterion for quantifying the risk of each strategy compared to the market, we have instead selected the following indicator:
where and are the volume-weighted average prices obtained through the strategy (NFK or SO) and the market respectively, and the exponent $k$ can be a generic integer. In our analysis, we chose to use $k = 2$ to give relevance to the most extreme variations of VWAPs.
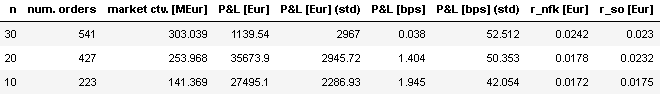
The table below shows the outcomes of the comparison test between the NFK model and the SO strategy, performed on the first $n$ FTSE MIB stocks in decreasing order of capitalization, where $n = 30, 20, 10$ (for very small $n$, let’s say $n$ ${\scriptstyle\lesssim}$ 10, the corresponding orders are few and hence the results could be more subject to randomness).
 |
||
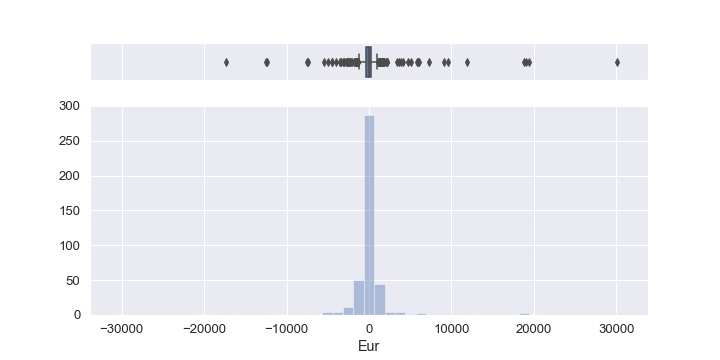
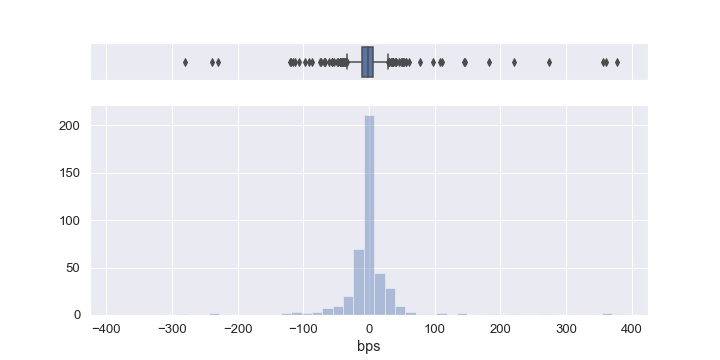
The number of orders and the whole market countervalue (expressed in millions of euros) implicated for each $n$ are displayed in the second and third columns. Furthermore, the columns from fourth to seventh present the gain indicators with the relative standard deviations, from which we note that, in terms of P&L, our strategy produces an overall gain with respect to the Smart Order of 1139.54 euros (0.038 bps), 35673.90 euros (1.404 bps) and 27495.10 euros (1.945 bps), for $n = 30, 20, 10$ respectively. We observe that these P&L gains are not considerably high and that, as $n$ increases, the SO can recover a little. Moreover, the related standard deviations are quite large, and this is also evident from the box plots and histograms below, showing the P&L distributions in Eur (left) and in bps (right) for all the orders involved with $n=20$ (the other cases are similar). In fact, from them we can infer that there are many orders falling far from the median values. The significance of these findings is therefore not remarkably high, but the results sound however good and promising regarding our model.
 |
 |
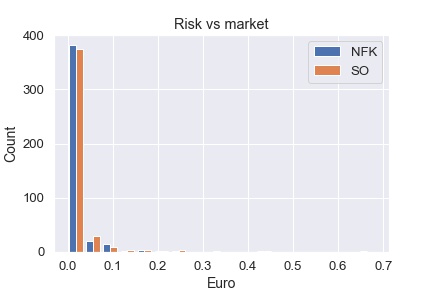
For what concerns the risk, from the last two columns of the table we notice that NFK keeps closer to the market (i.e. the risk is lower) compared to the SO, except for $n=30$, though in this case, as well as in the others, the differences between the two corresponding values are quite tiny. This is also visible in the histograms at the side, plotting the distribution of the risk, in Eur, of NFK (blue) and SO (orange) with respect to the market, for all the orders at hand with $n=20$ (as for the plots above, the other cases are analogous).
All the outcomes presented here confirm the conclusions of the previous post and point out that, even when applied to an extended dataset with a very large statistics, a reinforcement learning approach like ours is able to perform overall better than the Smart Order.
To conclude, it is due to mention however that the LIST Smart Order possesses two objective advantages over the NFK model, which we list below.
-
According to our strategy, the limit orders placed in every interval are executed only in the case the book moves favourably and not if they are hit by some market order, as we do not have access to the market order data of the other traders, information that the SO has available.
-
The trader may interfere with the Smart Order by suspending, accelerating or terminating in advance its execution, depending on the evolution of events. On the contrary, we never speed up nor block the order execution, but always follow the volume curve and liquidate a fixed quantity $q$ in every interval, i.e. we set some constraints that the SO can instead overcome. Therefore, the orders we have dealt with seem to be by construction favourable to the SO.
Given these conditions, it is clear that our strategy competes a priori behind the Smart Order policy. For this reason, the favourable results obtained for the NFK model turn out to be even more significant.